Commercial Mobility & Q1 Fleet Performance Analytics Dashboard
Project Overview
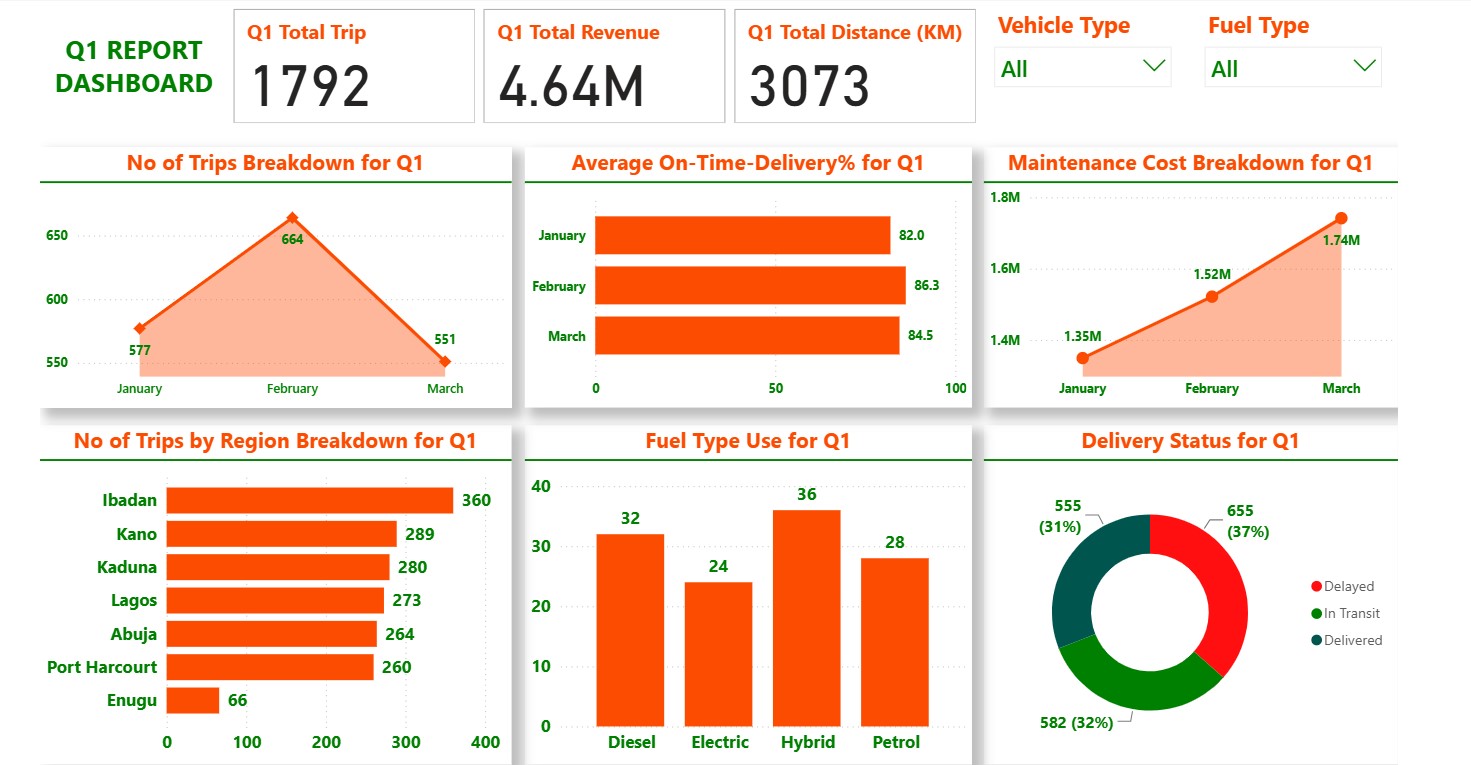
A comprehensive Power BI business intelligence dashboard developed to evaluate first-quarter operational mobility performance, service level agreement (SLA) fulfillment, and fleet expenditure trends across major urban routes. The executive report consolidates core operational KPIs, tracking 1,792 total trips, 4.64M in total revenue, and 3,073 kilometers traveled during Q1. The visual workspace provides visibility into monthly trip fluctuations, regional route concentrations across 7 key hubs, vehicle engine/fuel type distribution, and escalating maintenance costs.
Challenges
The mobility operations team required a centralized analytical system to address key visibility and operational performance gaps: High Delivery Delay Rates: A significant portion of shipments suffered from arrival delays, requiring granular delivery status tracking to protect customer SLAs. Escalating Fleet Maintenance Expenses: Monthly repair and servicing costs were rising continuously over the quarter without direct visibility into fleet asset performance. Regional Operations Imbalance: Difficulty tracking trip distribution across regional corridors, leading to potential asset over-allocation in high-volume regions and under-utilization in lower-volume hubs. Multi-Fuel Asset Monitoring: Lack of unified tracking across mixed-engine fleet assets (Diesel, Electric, Hybrid, Petrol) to evaluate overall fleet readiness.
Solution
A single-page, highly intuitive executive reporting dashboard was engineered with global header filters and dedicated visual diagnostic panels: Header KPI Scorecards & Global Slicers: Prominent top metric cards displaying Q1 Total Trips (1,792), Q1 Total Revenue (4.64M), and Q1 Total Distance (3,073 KM). Interactive header drop-down slicers for Vehicle Type and Fuel Type to enable dynamic cross-filtering. SLA & Delivery Status Analytics: On-Time Delivery (OTD%) Tracker: Evaluates monthly fulfillment percentages (January: 82.0%, February: 86.3%, March: 84.5%). Delivery Status Donut Visual: Audits active shipment status, revealing 655 Delayed trips (37%), 582 In Transit trips (32%), and 555 Delivered trips (31%). Trip Trends & Regional Corridor Distribution: Monthly Trip Trend: Tracks volume shifts from 577 trips in January, peaking at 664 trips in February, and settling at 551 trips in March. Regional Trip Breakdown: Ranks dispatch volume across 7 key locations led by Ibadan (360), Kano (289), Kaduna (280), Lagos (273), Abuja (264), Port Harcourt (260), and Enugu (66). Maintenance Expense & Fuel Type Utilization: Maintenance Cost Trend Line: Highlights steady expenditure increases from 1.35M in January to 1.52M in February and 1.74M in March. Fuel Type Distribution Column Chart: Categorizes asset utilization across Hybrid (36), Diesel (32), Petrol (28), and Electric (24) engines.
Results
✓ Complete Q1 Executive Visibility: Consolidated 1,792 completed trips and 4.64M in total fleet revenue into a single reporting portal. ✓ SLA & Delay Bottleneck Identification: Pinpointed that 37% of overall deliveries (655 trips) experienced delays, establishing a baseline to drive improvements toward the peak 86.3% February OTD rate. ✓ Proactive Cost Audit: Flagged a 28.9% quarter-over-quarter surge in maintenance expenses (from 1.35M to 1.74M), enabling management to audit fleet servicing schedules. ✓ Regional & Asset Balancing: Identified Ibadan as the primary dispatch corridor (360 trips) while establishing fuel-type baselines to optimize vehicle allocation across mixed-fleet assets.