HR Performance Appraisal Analytics Dashboard
Project Overview
An enterprise HR performance analytics solution developed in Power BI to evaluate employee appraisal outcomes, track performance trajectories, and analyze workforce health across five consecutive quarters (Q3 2023 through Q3 2024). Leveraging advanced DAX time-intelligence calculations and dynamic bookmark navigation controls, the dashboard consolidates individual appraisal distributions, quarter-over-quarter headcount shifts, and multi-period performance comparisons into a single interactive workspace. Workforce performance is benchmarked across seven standardized rating tiers ranging from Treasure (100%–95%) down to Unsatisfactory Performance (<50%).
Challenges
Static Period-in-Time Reporting: HR leadership lacked visibility into multi-quarter employee appraisal trends, making it difficult to measure talent growth or performance decline over time. Canvas Clutter & Navigation Complexity: Presenting trend lines, single-quarter distributions, comparative matrices, and variance calculations on one screen created cognitive overload. Complex Multi-Tier DAX Calculations: Requiring dynamic DAX logic capable of calculating overall appraisal counts, period-over-period percentage variances, and percentage-of-total distributions across dynamic slicer combinations (Category, Period, Indicator).
Solution
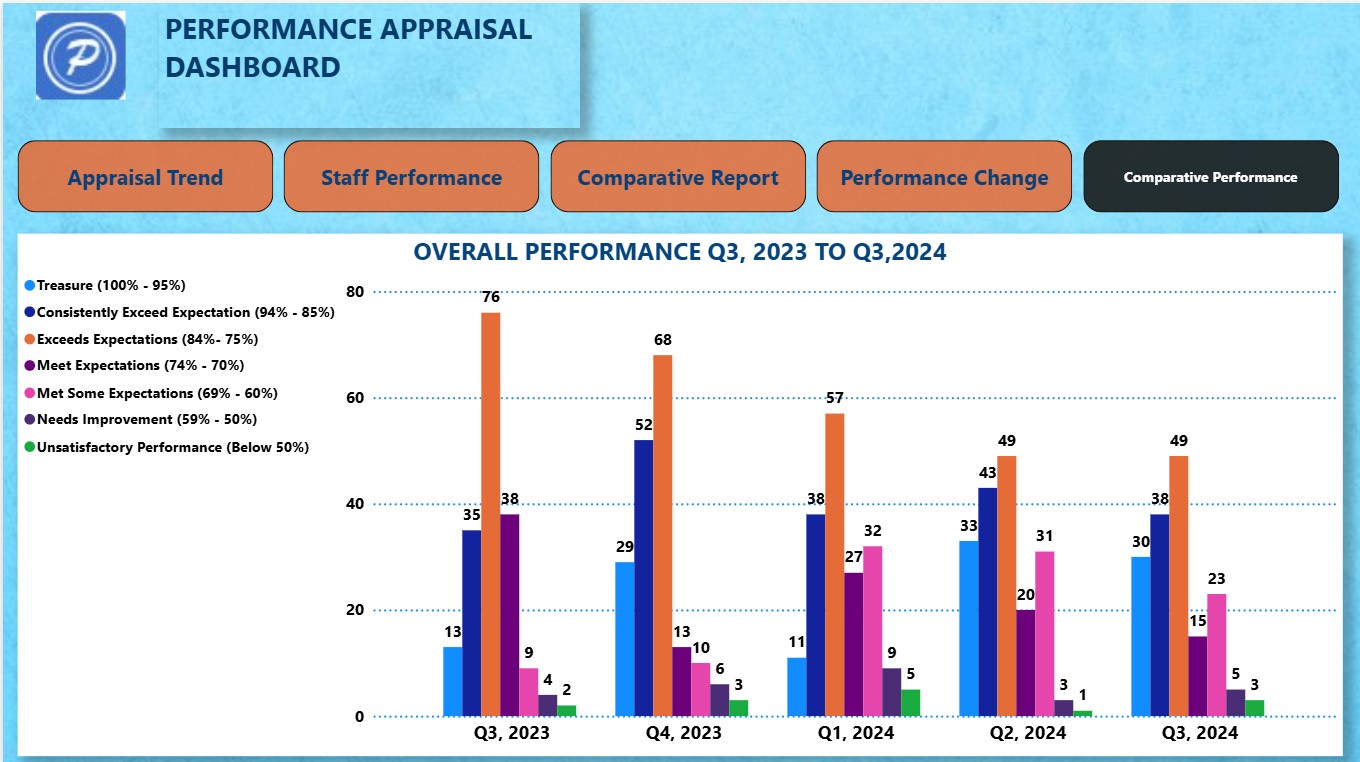
A five-tab interactive Power BI workspace powered by custom DAX calculations, period slicers, and seamless bookmark navigation: Bookmark Navigation Architecture: Embedded interactive tab controls—Appraisal Trend, Staff Performance, Comparative Report, Performance Change, and Comparative Performance—allowing users to cycle through distinct reporting layouts without leaving the main canvas. DAX & Time-Intelligence Engine: Formulated DAX measures to calculate appraisal headcount, percentage-of-total ratings, and automated period-over-period variance percentages (e.g., tracking headcount changes between Q2 2024 and Q3 2024). Five-Stage Analytical Views: Appraisal Trend: Line chart auditing total evaluated staff volume over time (peaking at 181 employees in Q4 2023 and tracking through 163 in Q3 2024). Staff Performance: Combo Pareto-style chart breaking down Q3 2024 appraisal distributions across all seven performance tiers (Exceeds Expectations leading at 30.06% / 49 staff, followed by Consistently Exceed at 23.31% / 38 staff, and Treasure at 18.40% / 30 staff). Comparative Report Matrix: Comprehensive grid detailing staff count and percentage proportions across all seven rating brackets from Q4 2023 to Q3 2024. Performance Change Variance: Targeted period-over-period comparative card displaying headcount shifts (e.g., 180 staff in Q2 2024 vs. 163 staff in Q3 2024, highlighting a -9% variance). Comparative Performance: Multi-bar cluster visual comparing volume trajectories across each performance tier over five quarters. Global Slicers: Header filter options for Category, Period, and Indicator to isolate specific employee cohorts and appraisal indicators.
Results
✓ Unified HR Command Center: Combined five distinct analytical reports into a streamlined Power BI canvas using bookmark navigation. ✓ Automated Variance Analytics: Integrated DAX time-intelligence calculations to deliver automated quarter-over-quarter change tracking (e.g., identifying the -9% evaluated headcount shift between Q2 and Q3 2024). ✓ Talent Health Benchmarking: Demonstrated high overall organizational performance, revealing that 71.77% of evaluated staff in Q3 2024 fell into the top three performance tiers (Treasure, Consistently Exceed, and Exceeds Expectations). ✓ Low-Performance Identification: Isolated underperforming tiers (Needs Improvement at 3.07% and Unsatisfactory at 1.84% in Q3 2024), providing HR leadership with actionable metrics for targeted performance improvement plans (PIPs).