Green Destinations HR Analytics Dashboard
Project Overview
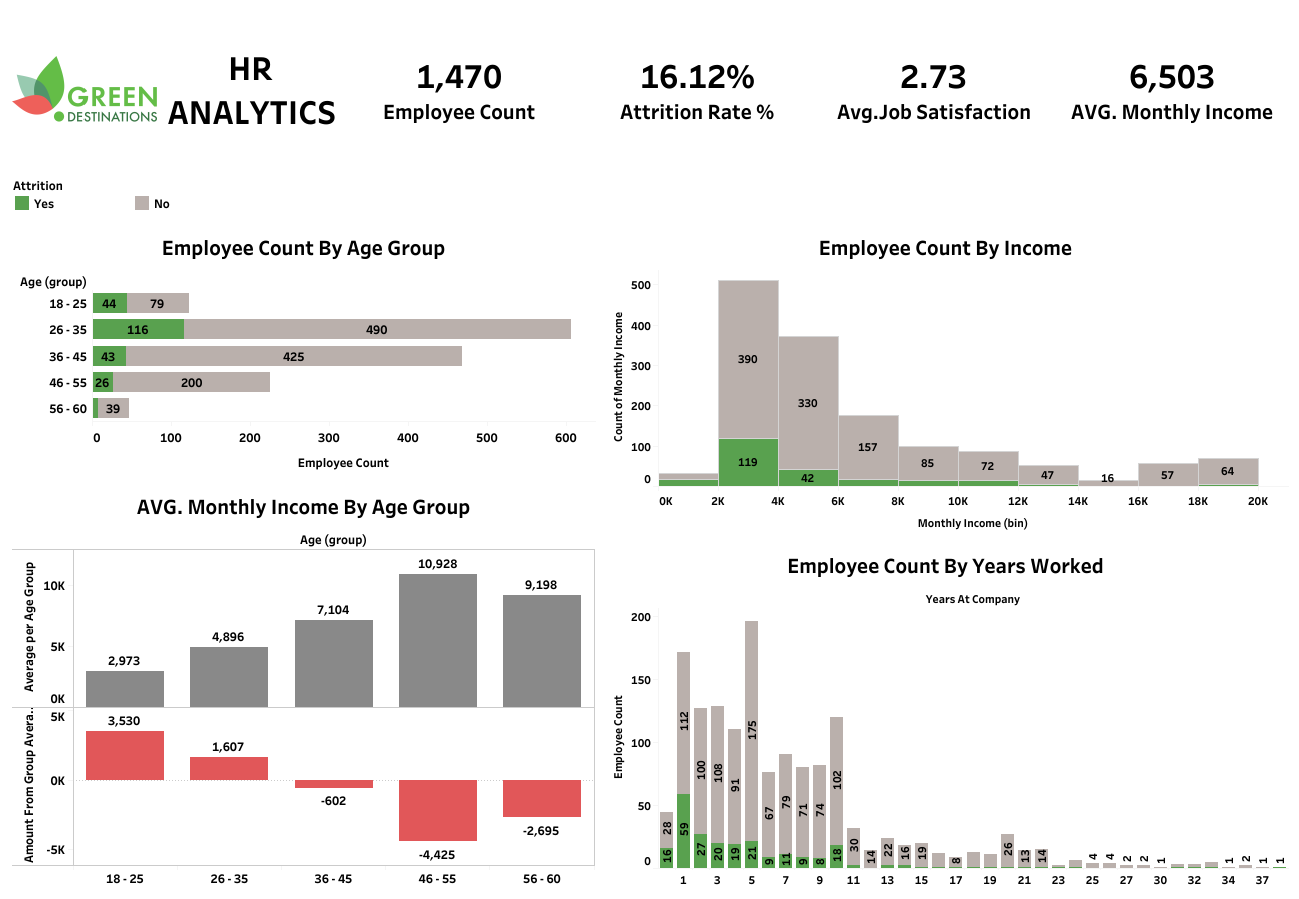
Green Destinations required a consolidated workforce analytics dashboard to track employee turnover patterns and identify key drivers influencing attrition across the organization. Built in Tableau, the HR Analytics dashboard centralizes demographic, compensation, and tenure metrics into an interactive interface, empowering HR leadership to evaluate how factors such as age, monthly income, years worked, and job satisfaction impact employee retention.
Challenges
The organization sought clear data insights to answer several core human resources questions: Turnover & Attrition Quantification: Lack of visibility into overall organizational turnover, requiring precise measurement of total workforce headcount (1,470 employees) and exact attrition percentage. Demographic Driver Identification: Inability to isolate turnover trends across specific age brackets (18–25, 26–35, 36–45, 46–55, 56–60) to determine high-risk employee groups. Compensation & Tenure Impact: Difficulty evaluating how salary distribution (average income of $6,503) and years worked at the company correlate with an employee's decision to leave. Workforce Satisfaction Benchmarking: Need to gauge qualitative workplace sentiment (average job satisfaction score) alongside quantitative compensation and tenure data.
Solution
A multi-tiered Tableau dashboard was designed and deployed to deliver actionable workforce analytics: Executive KPI Scorecards: Formatted prominent top-level metrics displaying total employee count (1,470), attrition rate (16.12%), average job satisfaction score (2.73), and average monthly income ($6,503). Age Demographic Analysis: Built horizontal stacked bar charts segmenting employee headcount and attrition across age categories to isolate retention risks. Income Distribution & Variance Analysis: Integrated an income histogram (0–20k range) alongside comparative bar charts evaluating average monthly income and salary variances by age group. Tenure Distribution Breakdown: Formatted a granular "Years Worked at Company" distribution chart to trace attrition spikes across distinct employee tenure milestones. Interactive Filtering & Web Deployment: Published the dashboard to Tableau Public, enabling dynamic filtering by attrition status for in-depth root-cause analysis.
Results
The solution provided clear operational clarity and actionable insights for HR management: ✓ 16.12% Baseline Attrition Identified: Delivered immediate executive visibility into overall turnover across the 1,470-employee workforce. ✓ Compensation Benchmarking: Established $6,503 as the average monthly income benchmark to assess salary equity and variance across age brackets. ✓ Targeted Retention Strategies: Highlighted attrition spikes within early-tenure employees and specific age groups, allowing HR to implement tailored retention programs. ✓ Satisfaction Baseline: Quantified workforce sentiment at a 2.73 job satisfaction score to benchmark future HR engagement initiatives against turnover rates.