Logistics & Haulage Revenue Analytics Dashboard
Project Overview
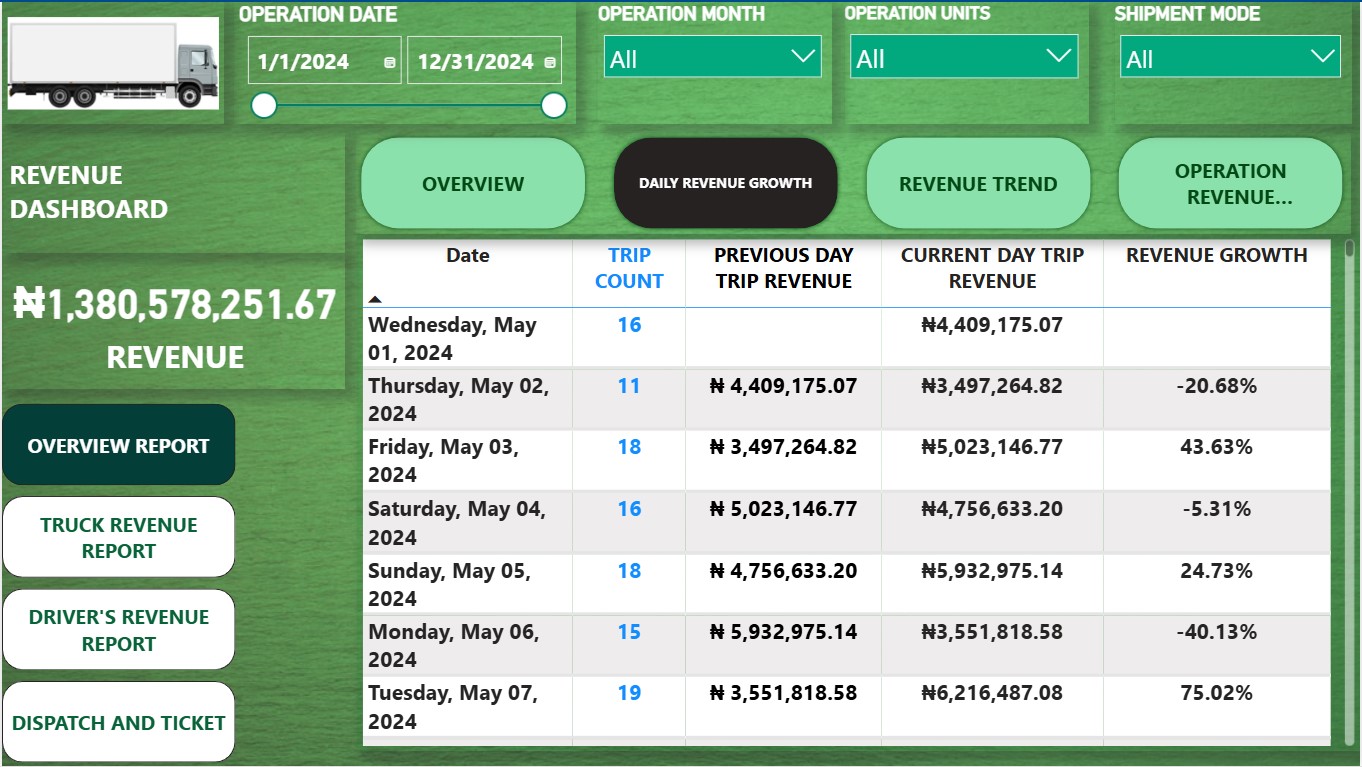
To eliminate reporting fragmentation across financial and field operations, an integrated Power BI App workspace was engineered for executive leadership. The solution consolidates two core management tools—the Logistics Revenue Dashboard (tracking ₦1.38B+ in haulage revenue across 5,514 trips and 1,277,846 km) and the Fleet Operational Performance Dashboard (tracking CICO, YIGO, OTD SLAs, and safety compliance)—into a single web application. Accessible via a single URL, this unified portal equips the General Manager with end-to-end visibility into revenue yields, operational efficiency, and cost controls.
Challenges
The organization required a unified executive reporting system to solve critical operational and data challenges: Fragmented Executive Reporting: Lack of a centralized interface requiring leadership to navigate multiple disparate reports to connect revenue figures with operational execution. UI Complexity & Multi-Dimensional Data: Managing extensive operational data (daily revenue trends, asset performance, route volumes, turnaround SLAs, and safety logs) without overloading the dashboard display. SLA & Turnaround Bottlenecks: Inability to easily identify where delivery delays occur—whether at customer locations (CICO), internal yards (YIGO), or transit routes (OTD).
Solution
An enterprise Power BI App workspace was structured with standardized navigation, dynamic bookmark controls, and comprehensive operational modules: Power BI App Workspace Integration: Embedded multiple report views into a single, seamless web application workspace, granting executive leadership single-link accessibility across all corporate logistics data. Unified Navigation & UX Architecture: Page Navigation Panel: Persistent left-hand menu structured into two major sections: Revenue Analytics (Overview, Truck Revenue, Driver's Revenue, Dispatch & Ticket) and Operational Performance (Summary Report, Overview Analysis, Trend Analysis, Engagement Analysis). Bookmark Navigation Switchers: Canvas-level bookmark tabs (e.g., toggling CICO, YIGO, OTD on operational views; toggling Distance, Trips, and Revenue on asset views) to dynamically present multiple visual layouts on a single page. Revenue Analytics Module: Tracked ₦1,380,578,251.67 total revenue split between 87.90% Trip Revenue (₦1.214B) and 12.10% Availability Revenue (₦167.0M). Segmented unit performance: Unit ABC generated 52.64% (₦726.8M) and Unit XYZ generated 47.36% (₦653.8M). Fleet Operational & SLA Performance Module: Tracked core turnaround KPIs: Customer-In Customer-Out (CICO) achieved 7.96h (vs. 8.0h target), Yard-In Yard-Out (YIGO) recorded 5.00h (vs. 4.0h target), and On-Time Delivery (OTD) achieved 91.0% in July (rebounding toward the 95.0% SLA target). Evaluated fleet distance utilization (116,201 KM achieved against the 225,000 KM target; 51.64% completion rate).
Results
✓ Unified Executive Portal: Simplified executive decision-making by consolidating financial and operational performance metrics into a single Power BI App workspace accessible via one link. ✓ Full Revenue & Allowance Auditing: Delivered complete financial transparency across ₦1.380B+ in haulage revenue while auditing ₦59.6M in driver allowances relative to distance covered. ✓ SLA Recovery & Bottleneck Identification: Tracked OTD recovery from 82.0% in June up to 91.0% in July, while isolating internal yard dwell times (YIGO at 5.0h) as the key target for operational streamlining. ✓ Actionable Cost-Control Drivers: Flagged 48 idling violations and high-risk driving behaviors (0.34% index).